27th Session of the IPHC Research Advisory Board Day 1, part 2
Alaska News • • 139 min
Articles from this transcript
Halibut commission staff ask advisers to help redesign sand flea logbook reporting
Halibut commission staff told advisers their first attempt to track sand flea damage in fishing logbooks flopped, data was too thin and inconsistent to use.

Underwater shuttle held halibut in killer whale trials, but no further work is planned
A test device kept killer whales from stealing halibut off hooks near Dutch Harbor, but the halibut commission has no further trials planned.
A design of a company out of Norway called Sago Solutions, and this is the Sago Extreme. It's a stainless steel and aluminum device that rides down the groundline. As you go to haul the gear, it's threaded onto the groundline. As it gets near the bottom, it just keeps moving forward as the groundline is being lifted up. It passes over the hooks.
The caught fish go inside the device. They get released inside the device, and then the hook and the groundline continue out the back end of the device. Eventually, it runs into a stopper, which you see in the lower right-hand image that's been pre-installed onto the groundline.
It acts as a stop to the actual device, and it kind of plugs up the entryway so fish don't swim out. And then the whole device rides up through the water column, kind of like an elevator with fish inside of it, and then it's hauled aboard the vessel up at the surface. So it's now got the fish inside of it. The whales can't get into the device. Gets brought up onto the vessel, and it has a door that the fishers can open up, spill the fish out onto the deck.
So last year we went out to do some work out of Dutch Harbor in the presence of killer whales. So I reported on this first last year, and we've done a little more assessment of those sets that I'll be reporting on here. We're still not quite done the evaluation of all the underwater footage, but We fished 18 sets, 15 that had the shuttle and control catch comparisons, so we could compare the two. And 6 of those sets had obviously depredating killer whales around at the time. Yes, Brian.
Were the 6 sets that had killer whales the first 6, or did they like get discouraged and go away, or was it just kind of—. It was, yeah, it was just kind of randomly throughout. We got chased around a lot by weather, and so did the whales that appeared. And they'd be there for some sets, not for others. Yeah.
So we did this off the fishing vessel Oracle that you see on the left there. That's the shuttle being hauled up onto the surface. Third picture, that's the typical evidence you get when killer whales are around, that something's going on. And the whales were quite aggressive. They'd even come charging towards the boat when you got on site.
So this is the retention trends in the shuttle from the analyzed footage. So we wanted to make sure that as the device is getting near the bottom, that we're not losing a lot of fish to the outside of it, or are we losing any to the inside of it, anything like that. So we had 3 different sets of cameras. We had a set on the outside, a set looking at fish coming in to see if they actually make it in or get sloughed off to the outside, and then an inward-facing camera that shows whether the fish were getting removed successfully or not, or whether they went right through the device. So for Pacific halibut, on the sets that we've looked at so far, we had only one fish that was excluded, and it, so it came as on its way in, it got flung off to the outside.
All those that entered did not escape, so that we had good retention of them, and we did have a few that passed through. Those were small-sized halibut that were able to go right on through the device with the hook. But we had pretty high retention rates. Sablefish and peacod, which are also of interest to the whales and to the fishers in the area, had a much lower retention rate, and we believe that those are things that are fixable. If you remember back to the image of the shuttle, it has kind of ventilation gaps all along the side.
Those also help its orientation as it's moving through the water. Those can be modified so that small rounded cylindrical-shaped fish don't pass through so easily. The other thing we noticed was the camera showed us that the stopper wasn't fitting snugly to close that door. So on the way up to the surface, especially if there was pauses in holding the shuttle partly in the water column for some reason at the surface, fish would often drift out of it through that opening where the plug was supposed to be. Those are easily fixable things.
Rockfish retention rates were not as good. We saw a lot more excluded, and that had to do with sand fleas. So you'd have a badly sand flea rockfish approaching the device. It would hit the tines on the outside and just explode into a cloud of debris and sand fleas. So we didn't get as good retention there.
We had very similar size retention of halibut, both in the device compared to the control. So it's good at capturing large fish.
As far as catch rates by treatment, so these are the ones that have been looked at on the camera footage so far. It was very variable. So blue is the control. That's what we saw on the gear that didn't have the shuttle. Orange is what we found inside the shuttle as far as numbers of fish per treatment.
And ones with a dorsal fin are ones that we had killer whales present. So we saw some similar captures on 5, or sorry, on 2 and 17. We had some cases we got, you know, we thought it was, we're seeing something good here. We had no fish on the controls and we had some on the shuttle, but then we had the exact opposite happening as well. So it was kind of all over the place and probably it's affected by sample size and how well the device was functioning as well.
So in conclusion, the shuttle's capable of good retention. Catch rates were quite variable between the control and the shuttle. One of those, we saw the catch rate completely change where we had red rockfish. So we had moved into a rocky habitat with a section of gear that had the shuttle, and we had some challenges with snarling with old ghost gear, old crab pots and things like that.
So, overall, the shuttle can be safely deployed and retrieved by vessels with a picking boom. It's roughly— the units we're using are 20% smaller than the typical ones used out of the Norway manufacturer, but they were 8.5 feet by 2.6 feet in diameter, the shuttle, and it weighs about 220 pounds. It's 100 kilos. So, that's empty. And we had up to 1,200 pounds inside the device, so it had reasonable capacity to bring fish up.
Some simple modifications could be used to increase retention of smaller species if that's of interest, so peacods, sablefish. We do continue to hear interest from the fleet to this approach. Some further steps that could be made to help foster kind of adoption of this as a tool to be used would be things that reduce damage to the fish. So we're required in our regulations to release sublegal fish with minimal damage. This device releases them naively.
It's just yanking the hook out. So something like weaker ganyons, softer hooks, or modified hooks could be used to minimize that. Another possibility there would be to pursue a regulatory change that would allow you to retain sublegals when using the shuttle device so that you're minimizing damage to the fishery overall, or removals to the fishery rather, overall. And then one other thing that could be considered would be a collapsible design that would allow for easier storage and transport and movability of the device. It takes up a chunk of space on the deck, and that's something to be considered, but it's certainly a usable device that the crew were very quick in figuring out how to use it effectively and efficiently as far as setting and retrieving it.
Yeah. When you come to the predetermined stopper, place where the stopper is going to bring the unit up, and if, if that's not the end of your set, you're going to have to have, I'm assuming, some running line in between the stopper and the next portion of that set. And if you're fishing black cod, it would be quite a bit of running line depending on your depth, of course, or halibut too. Is that how that would work? And then do you send the shuttle back down that blank line without any hooks on it till you got—.
Yes. Till you hooked the portion of the—. Yeah, so that's correct. So the way we use this device, we didn't want to introduce animals into the water column if we could at all help it, 'cause we believe that's where the majority of depredation is happening. And so we had a blank set of line that we would thread the device onto that was between the control gear and the gear that took the shuttle.
And so we would then thread it on and let it ride down to the bottom and do its job. In practice, these devices are being used quite a bit in the Patagonia toothfish industry, and they have sets there where they're setting these units. They'll, they'll own like 20 of these shuttles and they'll set one every 300, 400 hooks. And so the one will engage, it'll hit the stopper, and then the next one engages while the one rides its way to the surface. Others use this blank line gear with stoppers installed in case they need to use it if whales are present, or they'll choose not to use it if whales are not present.
So there's a few approaches there. For our study, we use the blank method that you just described.
Bruce, this, this is just back on discard mortality slides there. It's not 100% related to that, but are you able to pull the data out on CPUE for different sized hooks? Yes, we could do that. I'm curious to see that. You know, I know there was higher mortality with smaller hooks, but it'd be interesting to know what the CPUE is, especially nowadays we've got a lot of small fish.
16/0 Hooks, big, big tackle for—. Yeah, so we did see that we caught larger fish on average with that, uh, with the 16/0, but, um, you know, in reality the single largest fish was actually caught on a 12/0. Um, so, but we did have higher injuries of that, but we do have all that length data. I'd be curious. Yeah, thanks, Claude.
Okay, thank you, Claude. So that brings an end to the research presentation.
If the Secretary can bring up the presentation for 521.
That will be the presentation for the Info Paper 1, for the agenda item 521, Info Paper 1.
And if I could please just get the control so I can move slides.
Great, thank you. So this is a preliminary assessment of sand flea prevalence in Pacific halibut commercial fisheries. And as a part of a background, this presentation is specifically a response to RAP's request, where, where RAP requested that the APHIS Secretariats set up efforts to increase documentation of samphire occurrence during commercial fishing activities by encouraging fishing vessels to report such occurrences in logbooks and to also relay this information to IPHC Fisheries data specialists in the field. So I will note that this presentation and this analysis has not been done by me. This work is This presentation is adapted from work prepared during the summer of 2026, so this summer, by one of our interns, Will Mixon, who selected the prevalence of sand flea infestation in Pacific halibut as his research project topic.
So as a part of IPHC internship program, interns help with some of our recurring activities, such as photographing Pacific halibut otoliths and helping with essays from the fin clips, but they also partake in selected project and undertake research on the selected topic. So this, this was one of these topics available and was selected. This work was supervised by me together with Dr. Hicks and Dr. Stewart and also benefited from discussions with IPHC fisheries data specialists in the field, the FIS team both in headquarters and in the field, and by Claude Dijkstra.
So again, this is interpreted from Will's presentation and report. I hope to summarize it for you well, and I will be happy to answer any questions. So in terms of background, This is on wildlife conflicts. Bottom longline gear is vulnerable to depredation and scavenging, and the Pacific halibut directed fishery relies on this gear, and it is therefore exposed to depredation scavenging. Data collection and adaptive strategy are critical to minimize those wildlife conflicts.
And the sand fleas are common bending scavengers. They— I have here video. Is that the correct presentation? Because the video is not working.
Secretariat?
Anyways, the sand fleas are common benthic scavengers. They damage— the damage they cause is lowering the value and makes fish often unmarketable. And this is a well-known problem to fishermen, but it is actually very little studied in practice. And here you can see the effects of sand fleas, and I wanted to show you also the video from the Catch Protection study where you can see them, how kind of swarm of them can be really there close to the bottom and affect the fish. The fishermen have also long have experienced the sand flea problems, and there are a couple of known facts within the fishing communities.
We heard about what is known as hot bottom, which are sites known to captains that are particularly vulnerable to sand fleas. And captains often were noting that they avoid sand fleas by setting shallower, and they often do not set overnight in order to avoid sand fleas.
So the research objective of Will's, uh, project was to respond to the request. And specifically, there were two parts of that project. First was to evaluate available datasets, uh, and as a part of it, it was to determine which questions that the data can address, provide feedback on the Fishman-initiated data collection trial, and the proposed future avenues for investigation. And the second part was mapping and modeling infestation using the data that is already available to us from the Fisheries Independent Setline Survey. And here the, the research questions were: where is infestation concentrated and has this changed over time?
How do set depth, soak time, and bottom temperature affect the probability of infestation, and do they affect its severity?
In terms of methods, for the portion relying on the fish data, this approach is using standardized sets at fixed stations and using the, as I said, IPHC fishery independent headline survey conducted annually by the IPHC. And we'll, for this exercise, use the 2019 as a focus and additionally data from 2000 to 2024 for a 5-year comparison. And the modeling exercise used 2019 to 2025 data. And this data includes— and free damage recorded for each fish, biological data including length, sex, environmental data including bottom temperature and location, set depth, and soak duration.
As a second part, we also use commercial logbook data. As you might recall, the RAP had a lot of concerns regarding this problem, and therefore we initiated a new data collection. We, we did this as a trial in 2026, and on a voluntary basis, captains were able to note sand flea damage alongside other damage in their logbooks. This was either recorded directly in their logbooks or became part of the additional information that was recorded in their logbooks during the IPHC Fisheries Data Specialist's interviews. So the field staff that they encountered in the ports, they were asking about the sand fleas, and if the captains were willing to provide that information, that was recorded alongside the— in the logbook for for us to analyze later.
That data include per set number of Pacific halibut damaged by sand fleas, and for context, we also have total number of Pacific halibut landed, set location, depth, and soak duration. So these are the data available as a part of this new data collection.
In terms of modeling exercise, Because the 2026 data is limited, it's only including one year so far, Will was not able to do much specific analysis. So the modeling is focused on the FIS data. And the idea was to adapt the generalized additive model. And used predictor variables that included set depth, soak duration, and bottom temperature to analyze response variable. And for these response variables, he used a presence-absence of sand fleas, as well as tested the— as alternative infestation severity.
And in this case, this was calculated as a proportion of catch damage and this included proportion of infest— proportion of catch damage in infested sets only. And this type of generalized additive models, its benefit is that it captures nonlinear relationships. It can be used to binomial data, so it can be used for specifically for presence versus absence, and this was fit to 2019 to 2025 data. And he tested multiple different models, and what I will be presenting are the results based on what performed the best in terms of the outputs.
So here, first, some of the presentation of the data that was used. As you can see, this is the 2019 snapshot showing the assembly prevalence. And you can certainly see that there are some areas that are more heavily affected. The legend here is a little bit small, but you can clearly see there are some hotspots with the darker red showing on the map.
And here is the— how this is changing over time. Is it working?
I think we have some issues with the interactive parts of the presentation. So, uh, yeah, this is not working.
But in general, there's the— we, we did notice that from the FISS data, there, there are some areas of particular prevalence directly visible when these were mapped on the, uh, in a spatial, uh, area, like by different areas. In terms of results from the models, here's the results of the modeling exercise looking at the probability of infestation. So this is based on that model that used the sand fleas in a binary format. So whether the sand fleas were present or absent. And interestingly, some of these models show actually, they closely align with what fishermen were telling us.
More informally. So if you look at the first plot, this is clearly showing that deeper sets imply higher infestation probability, and this was according to the outcomes of this modeling exercise, leveling off at greater depths. We also shown in the model that longer soaks imply steadily higher probability of sampling infestation, And the temperature impact is that there's a possible peak near about 6°C, but this impact was highly uncertain. But these two first outcomes, higher depths, higher infestation probability, and longer soaks, higher probability, this is actually closely aligned with kind of in general knowledge within the fleet. Go ahead, Brian.
I'd just like to point out that your chart on the far left only goes out to about 200 fathoms, and after 200 fathoms, the percentage of sand fleas typically goes down. So I will go to the limitations of this analysis. So this is based on the Fishery Independence Alliance survey data. This is highly standardized data that is, you know, limited. It has a standard location, it is limited in terms of the soaking duration, and those, those are great for getting the indexes for the biomass, but it doesn't give us as much of a variability that we would want in terms of addressing the concerns about the salinophiles.
And that's why we did initiate that new data collection program. We just don't have enough data to provide this type of analysis based on that. And there are also some concerns because of the number of observations so far. We had some concerns regarding data confidentiality. That's why we are not presenting those results yet.
But what we wanted to show for this presentation is that there are some information that is already available to us. We have some data that could be used for analysis, and with your support and continuation of the data collection, we could, uh, like, take these questions a little bit further using the commercial data. Okay, there's just one other thing that it might be worth pursuing in the future, although it's probably pretty difficult because not everyone has the capability to do it, but bottom hardness might be something that's worth looking at as well. But there's a lot less sounders equipped with that as like a numerical quantity. It's usually just a visual thing on a lot of people's sounders, but that's another avenue to explore.
Uh, and we're certainly interested in some ideas about how to look at the— what else we can incorporate into the study. This was, as I said, uh, pretty small project that was, uh, done by an intern during the, uh, you know, couple of weeks they had here. But certainly if this is something that is of interest to RAP, we can continue looking to what else we could potentially do in order to inform this question and how this can also support the FIGSAC stock assessment by improving the understanding of the mortality.
So in terms of overall findings, particularly noting that the, the analysis was based mostly on the FS data, sampling prevalence is patchy. But there are high activity areas that persist across decades, and these areas are marked here on the map. I apologize that this should be visible also on that interactive map earlier, but that was, uh, the, the interactive component didn't work once it got uploaded apparently to the Adobe Connect. But we did see some of those higher prevalence areas, particularly in central Aleutians around Kodiak Island and in Southeast Alaska, especially around Icy Strait.
Depth and soak time relate to infestation probability, although these results had quite high confidence intervals, so we'll say that they, they would be relating pretty weakly. But this supports fleet tactics that we heard about from the fishermen. The tactics to do shallower sets or shorter soaks. There might be possible temperature optimum, but this is highly uncertain, and there are no clear drivers of severity. Those are results not shown in this presentation, but the, the present absence seemed to be working better as a variable that was modeled.
But then what we started talking about, the modeling exercise was based on the FIS data, and there are certainly a number of strengths to using that data. This is decades of consistent standardized data, and sampling damage is recorded for every fish. And this— because of that, we can easily express the sampling damage as rates to— and we can do it as rates and number of damaged fish to all Pacific halibut on damage compared to overall effort. But it has its limitations. The FIS includes data sets with standardized soaks, partly to avoid actually the infestation.
So it's not a great source of data about the infestation. And there's little information on long soaks or overnight sets, but— and this is by design. This is a coarse spatial resolution because we have a fixed station grid, and this occurs only in the summer. So there's— and there's also reduced footprint since 2020.
That's why the commercial logbooks with that data recorded would be a great supplementary source of information of this problem if this continues to be seen by you as a stakeholder's body as important problem to the fishery. So it really is intended to fill the gaps left by the FIS. It can include longer soaks and overnight sets. It will include the dense fine-scale locations, and it would include nearly year-round data. Obviously, in Alaska there's no year-round fishing, but actually starting from this year there will be also year-round fishing in British Columbia.
So it also provides a wider range of season in the data. Potentially it has its limitations. So far we are limited by the data availability. This was the first year this data was collected, and that's why some of those details were not shown to you today because of the confidentiality constraints. Uh, we note that the reporting varies widely between captains, and these include specific counts versus estimates and not fully comprehensive coverage, because we still learn and inform the fishermen about the importance of this project.
So before that, we— before this is kind of common practice within the fleet, we will not have comprehensive data.
We also found out that it was a little bit unclear whether no damage reflects a check for sand fleas. And this is also, of course, the reporting burden for the fishermen. So it's really weighting the benefits against the costs. So this is certainly a discussion topic that we would like to hear about from you. So as I said, we started collecting this data this year, and we are looking into advice on how to refine our data collection process, particularly any of you here that have experience and were asked for the first time about this data this year.
So there are a couple of questions here.
Um, what, what is the best approach for us to, to collect that data, whether it's to ask about Sanflees directly, not only alongside other damage, so absence is recorded explicitly. Maybe we need to clarify better what to count, or whether we should count the damage to sublegal fish or not, and when that damage should be recorded, whether we should be asking to provide that estimate to the field staff when you are interviewed on your logbooks, or make sure that we encourage reporting that directly in the logbooks. Maybe we should consider simpler categories that would be easier for fishermen to report, something like no sand fleas or sand fleas present, maybe no damage, damage reducing market value. So really here we would like to engage with the RAP to refine that protocol for that particular data collection. And I will also note that apart from that new data collection that is part of the logbook data collection, we also will look into the complementary signal on sand fleas through our sentiment survey.
In 2026, we also launched Fisher Sentiment Survey, which as a part of that survey includes one question that is related to the the biggest concern that each fishermen have in the fishing, in each fishing season. And one of the options include poor quality of fish, for example, the fish were small or infested. And this would give us a broad pulse of fleet concerns over time. So if you are a commercial fisherman and you have not filled that survey just yet, yet. I also provide here the QR code and you can fill it anytime.
It's a very short survey and it's meant again more of a kind of pulse on how you— what do you think how the fishing season went this year versus something more comprehensive, which is that data collection on sandfish specifically in the logbooks.
And I would really welcome discussion, especially on the commercial logbooks questions.
And to conclude, the fishermen are onto something. The avoidance tactics, shallower sets, shorter soaks, are partly supported by data that we analyzed. But we are really looking to improving our data collection. Clear logbook reporting, including absence, is key next step. We are also looking at identifying higher risk areas to reduce reduce loss quota and market value.
And RAP input will help design the next steps, particularly again about the reporting protocol and priority questions. And this is really intended to support overall mortality estimates because documenting infestation may support things, include our estimates, including the stock assessment.
Are you taking feedback on the survey? Sure. Can I recommend putting halibut at the beginning just so, because a lot of folks fish both, instead of black cod, if you're just looking for halibut information, like at the top when you scan that QR code? Oh, sure, we do typically distribute among only Pacific halibut fishermen, so that's maybe it's not as—. Yeah.
Okay, they may share it with each other. I think it's just worth, because a lot of people have both. And on question 4, is it possible to ask people to just rate them from 1 to 7 rather than only pick 2? Because you might miss— that's the only question that gets to this issue specifically, right? It's the only one that where poor quality small infested fish is an option.
And if things like market prices or weather happen to be a bigger issue, you might miss them even noting that. So it could be useful.
Angus online has a question as well. Angus, I see your mic is activated in green, but we can't hear you. Sorry. I was double muted there. Go for it.
Yeah, a couple of questions, comments. First of all, thank you, great presentation.
I was wondering whether you've thought about, I mean, it's just anecdotal, but I've heard from several BC fishermen where they figure if a trawl fleet's been working in an area for a while, that the fleas or lice seem to get worse. Yeah, whether that's something you've considered or would consider looking at going forward. And then as well, for the first time this year, I had a set where I set it early on in the year, not one liced fish, and I set it later on, I think in August, and yeah, it was huge lice, same soak times, you know, we're fishing sablefish, but we'd never do longer than 2-hour soaks. But yeah, it was just a couple of thoughts there.
Thanks, Angus. The issue about sand fleas and trawling overlap, that definitely came up as a part of the discussions about the project. Within the timeline we had for complete completion of this particular analysis, we were not able to access any additional trawl data to compare the locations, and we're actually not sure whether we can get the same level of spatial, uh, detail on troll data in order to compare it directly with the logbooks. But we continue to investigate that question, and if that data was available to us, that would certainly be something we would look at.
Thank you.
Any feedback on the logbook data collection? And so anyone fishing commercially, we— you should have received the flyer about that voluntary program to provide that additional data, and whether that was sufficient and clear enough, we would certainly like to hear about it.
Did that come onto the Float app in Canada?
It's, it's not part of the Float. This was part of the additional data that could be recorded on the paper. We provide the option how to record it in the logbooks that do not have specific specific fields for that. Uh, again, this is voluntary data collection that was— that could not be introduced as a kind of completely new field in the logbook, but, uh, um, we had our field staff asking about this as a part of their interview when possible.
I'll look into it for next year.
What were the field staff usually asking when they did their interviews, like presence, absence on each set, or like if it wasn't written in the logbooks, what was their interview like? So as a part of a trial, we asked to follow up with fishermen when, during the part of an interview that asked to do damage to Pacific halibut. So in IPHC logbook and NOAA logbook, there's a field number of Pacific halibut damage. So what we asked, if you would like to contribute to the study, please record how many of these damaged fish were, were damaged specifically due to sound play, to, to understand the proportion of the damaged fish, to understand the causes of that damage specifically. Because the, the currently in the logbook, the damage is, it's more of like a vague question about overall damage that could include damage due to well depredation, damage due to gear, and any other causes.
So we did not have any specific details about the damage cause. So we asked to specify how many of those damaged fish were damaged due to sampling. This seemed to be potentially challenging because it's hard to estimate specifically the number. So that's why we're asking here, whether your feedback would be on the data collection moving forward to potentially revise it to something that is maybe more simple, something more of a present absence, maybe something that is clearly indicating the impact on the fishing outcomes, such as this was enough damage that decreased the value of my fish. Marketable value versus not?
Because we do know that there's, it's a kind of spectrum, right? It's, it's not, uh, it's not such a straightforward question to ask yes or no, right? Human sampling is not a problem, but there's like a whole spectrum of the, of the damage that might occur and at what point it's actually causing, it's actually impacting the, the profitability of your, you know, hall, like coming from your hall.
And we do really see this, this project as being driven by the request from the RAP, so that's why we're— I'm interested in feedback.
Well, I think the logbooks now on the right-hand side of the column there, they have, like you said, how many fish are impacted, whether it's due to whales or whatever else is there, I can't remember. So to get sand flea documentation, I think as far as the reporting burden, it's not that much if there's something easy to check. Like if there's a sand flea box to check. And then like you said, it is quite a spectrum because when we're in sand fleas, if it's not too bad, you know, just around the edges, we'll, we'll dress it and sell it. And a lot of times they won't even number 2 it unless you push it too far.
And then they might number 2 it. And then there's ones that are just not like the pictures you showed are just not marketable. So I would think for your, for your data collection, I think it should just, there should be an easy box to check and the number of fish that aren't marketable should be put in there because that's the mortality thing you want to get a handle on, right? So the ones you can market shouldn't be part of your sand flea checkbox, but the 10 that didn't make the cut to sell should be. But it would be easier if it— if you didn't have to write sand flea in there and then do that.
There was a box like a whale box that you check, and it's like sperm whale, killer whale, orca, or whatever. Sam Fleet box. So I don't know how big a deal it is to modify that, that logbook all the time to add more data into it, but that would seem to be the simplest way for fishermen to deal with it. Because I don't really have any problem documenting how many sperm whales, although, or killer whales, but that's sort of objective too because you don't really ever know. Until they all pop up.
And sometimes they don't pop up at all. You just get a bunch of lips back and you never see one whale. So you're just guessing. And you never know how many, how many fish got damaged because not all the lips come back up. So it's just, you know, it's just keeping track.
But I think as far as the logbook's concerned, that's probably the easiest way to get the data. And if it was easy to mark a box and put down the number of fish, that would probably be the easiest way to go instead of trying to identify everything on the spectrum.
I'll just note that certainly distributing fully new version of a logbook is a challenge if we want to introduce a new field because it will have to go to the whole fleet. Right, right. Yeah, yeah. The only thing I'm—. You just, you're just— go ahead.
Yeah, the only thing I'm looking at on this is the, uh, the shakers. They never even—. On us, on the small boats anyway, they never even hit the deck. They're shaking off right at the rollers. So we're not going to be able to really give you a date on the sand flea.
I mean, because they're just— I mean, it's fast. We're just dumping them. You know, unless they're somewhat questionable, in which case they'll come aboard. But to give you a SAM flea rate on under 32s, probably not realistic, at least on the small boat fleet.
Thank you, that's helpful. And if you have any further comments or suggestions, I will— I'm here around the meeting, I'm happy to, to get that feedback. Thank you. Okay, thanks, Basia. Well, with that, we can move on to the next agenda item, 5.2.2, which is the fishery independent data presentations.
We have two presentations and papers associated with those presentations for you. The first will be from Kayla, and she'll be presenting an update on the 2026 fish season. So, Secretary, if you could make Kayla the presenter and then bring up the presentation. There we go. Beautiful.
Thank you very much. Over to you, Kayla.
We can't see your name in the list, Kayla. I can see you messaging me, but You're not showing up in the Adobe Connect list at all to make you a presenter. Any ideas?
Just sit tight with us while we fix this.
Secretary Kaler is indicating that she's just going to sign out and then sign back in again. So keep an eye for her.
Okay, I think I am all set. Can you hear me okay? Yes, we can. Go ahead. Sorry about that.
Okay, my apologies for not being present today. I do hope and plan to be there tomorrow to interact with all of you. I have a sick toddler at home today. Alrighty, so my name is Kayla Owalesi, for any of you who I have not met, though I do believe I have met most of you, and I am the IPHC Setline Survey Coordinator.
The purpose of today's presentation is to provide you all with a summary of the IPHC Fishery Independent Setline Survey design and implementation in 2026, and first we'll review the 3 objectives of the FIS. The primary objective for our survey is standardized fishery-independent data collection for the Pacific halibut stock assessment and stock distribution estimations to collect data for the Pacific halibut distribution and abundance trends and collect through the collection of biological data such as sex, maturity, and age.
Both the gear and bait are standardized on the Fishery Independent Setline Survey. In 2026, we had both fixed gear and snap gear vessels participate in the survey, 2 snap gear vessels and 4 fixed gear vessels actually.
Each skate meets the following specifications. Each skate is 1,800 feet long, with 100 hooks spaced 18 feet apart along the ground line. Number 3 circle hooks are threaded through the front on 24 to 48-inch ganyons, and 7 to 10-pound weights are placed on each non-anchored skate end.
In 2026, our bait was standardized at fro— as frozen chum salmon, um, at number 2 semi-bright or better, and this Chum salmon was cut at a quarter to a third of a pound per hook, and captains work alongside the IPHC secretariat on board to ensure that all bait that is deployed meets our standardized bait quality specifications. And then we ask that our captains sign off on this bait quality as well.
The secondary objective of the FIS is cost-effectiveness without compromising scientific integrity of the design, which we strive to achieve through the fish sale process where a request for tender is issued for each sale and each bid is rated against specified criteria that is provided to all interested buyers on the sales notice. The team has established controls for the review and approval of each sale, and when feasible, we do conduct multi-port bidding. This happens most often in Regulatory Area 2C. However, we have done it in 3A as well as throughout the, the survey footprint. In addition, our charter agreements have requests for tenders, and all submissions for our charter agreements are rated against specified criteria that are published in Tender Specifications Online.
We also strive to achieve our secondary objective through the sale of our sampled sublegal U-32 Pacific halibut. In 2026, the price was 23% less than legal size O-32 Pacific halibut average price. U32 Pacific halibut catch made up 8.5% of the overall landed Pacific halibut, 30,202 pounds for the 2026 FIS, and that made up 6.8% of the total revenue earned at $242,682.
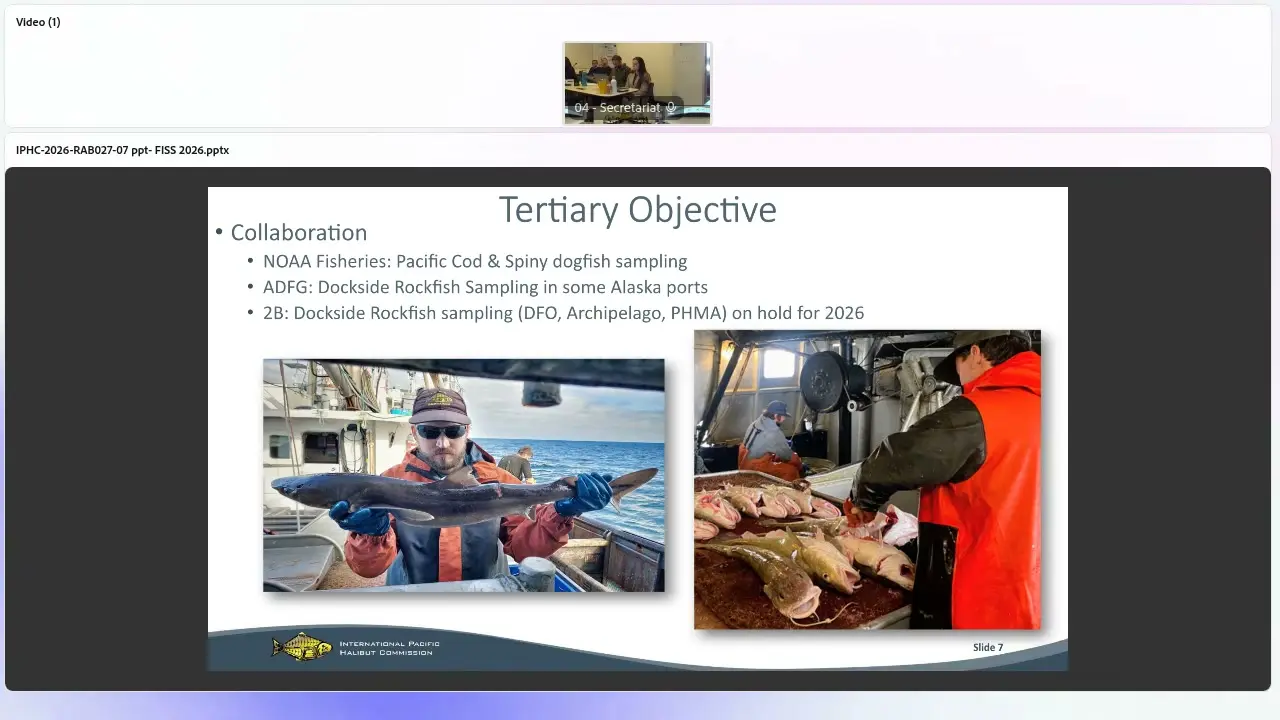
The tertiary objective of the FIS is collaboration. In 2026, we collaborated with NOAA Fisheries to collect Pacific cod and spiny dogfish lengths coastwide, both in Alaska as well as in BC. We also worked closely with ADFNG to collaborate with them for them to be aware of our Alaska offloads. And while I do not believe they were successful in sampling an offload this year, we are maintaining communications with them so that they can complete some rockfish sampling when they are available to meet our vessels. And I've left this collaboration on here for a number of years, but we do check in with our collaborative team in 2B each year regarding the dockside rockfish sampling in 2B.
It was on hold again in 2026, however, next year and moving forward, we'll continue to check in with the team that is made up of representatives from DFO, Archipelago, as well as PHMA.
Alright, this map shows the planned work for 2026. In 2026, we planned to complete 717 stations. The survey ran from the 22nd of May to the 15th of September. In comparison to 2025, when the survey ran from the 30th of May to the 5th of September, and in 2024, when the survey ran from the 24th of May to the 15th of August. We had 6 vessels participate in the survey, which was the same number of vessels in 2025, and 5 vessels participated in 2024.
Again, as I've stated, 717 stations were planned for for the 2026 VIS in comparison to 515— and forgive me, there's a typo here. So 515 stations were planned for 2025 and 525 stations were planned in 2024.
While this is the planned work, this new map shows what stations were sampled effectively. We had a total of 619 stations completed and sampled effectively in the 2026 VIS. There were 73 stations that while they were planned to be completed this year, were not sampled at all. We, in addition, we had 15 stations in Area 4B, which you can see that small, like, butter yellow color. Those were 15 optional stations that we had on our plans to add to the work in 4B if we were able to get a vessel to participate in that area this year.
Unfortunately, we were unable to do the work in 4B in 2026. And then in addition, the red, the spattering of red dots, though may be challenging to see on this graphic, there was 25 stations deemed ineffective during the 2026 FIS. And my next slide, will better illustrate those 25 stations that were deemed ineffective this year. As is the norm, particularly over the past years, whale depredation makes up the vast majority of our ineffective stations. 14 Stations total were deemed ineffective due to sperm whales.
Sperm whales, we had 6 stations in 2B, 6 stations in 2C and 2 stations in 3A deemed ineffective due to sperm whale depredation. And then there were 5 stations total due— that were deemed ineffective due to orca depredation, 4 of which were in 4A and 1 in 2C. We also had 4 stations deemed ineffective due to what we are categorizing them as other depredation. These were pinnipeds or sand fleas or shark depredation, which all 4 of those were in 2C. And then we had 2 stations that were deemed ineffective due to logistical issues, such as there being some— a gear issue or the soak time exceeded our standard 24 hours.
And there was one logistical issue station in 2C and then one in 3A that made up for our total of 25 stations.
Now, instead of focusing on that number of 25 stations, it is better to consider the percentage of ineffective stations in comp— uh, that were for the entire year. This year in 2026, we had 3. 4.9% Of these stations deemed ineffective. Now changes in the survey design from year to year will continue to influence the number of ineffective stations. In years past, regulatory area 4A seemed to lead the cause for whale depredation and therefore increased ineffective stations overall.
However, this year in 2C, we actually had the most ineffective stations due to sperm whale depredation and sand flea depredation.
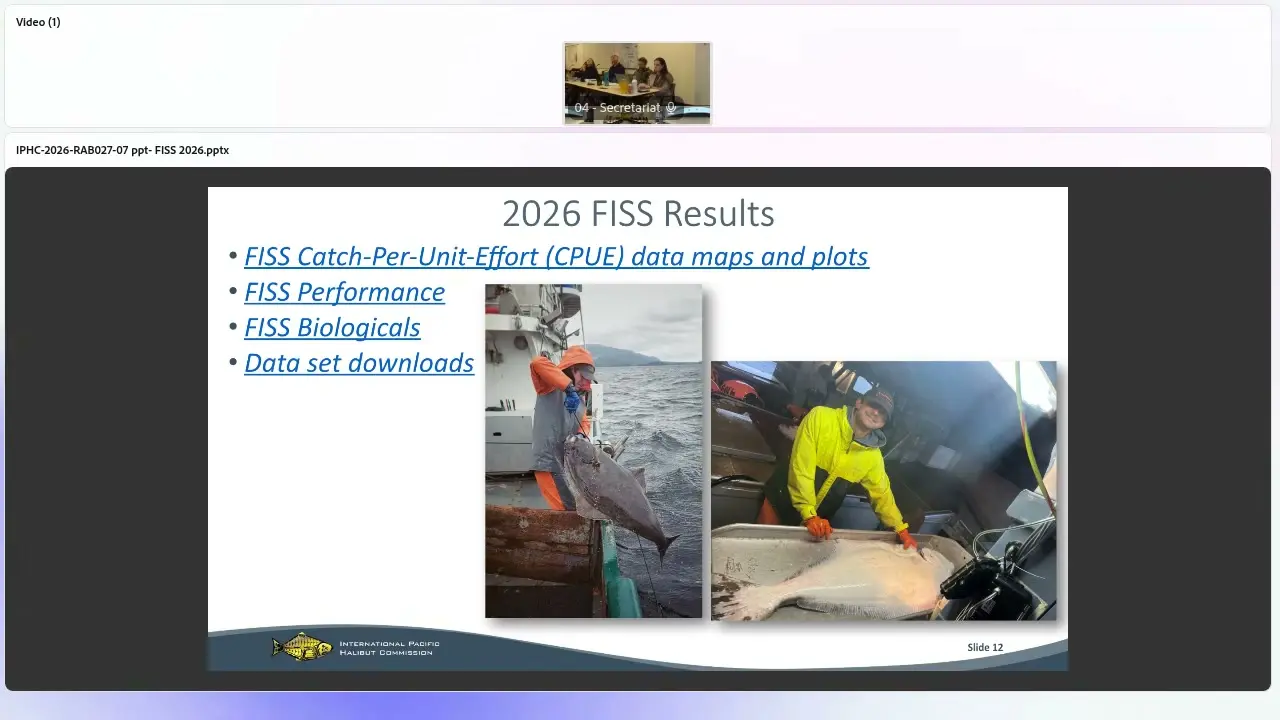
This slide provides links to the IPHC website where you can access data from the 2026 VIS as well as previous years.
All right, and now I will review the Average price per pound by IPHC regulatory area. As all of us are, are very aware, pricing this year was, was up considerably. In 2B, we saw an average price of $10.83. 2C, $10.34.
3A, $9.51. In regulatory areas 3B and 4A, our Pacific halibut and bycatch were sold to the frozen market. So there was a little, a bit of a decrease in price in these areas. However, when you compare that to prior years and just in general, $7, over $7 for the frozen market is certainly nothing to complain about. In 3B, we saw a price at $7.34, and then in 4A, our average price was $7.60, making our coast-wide average $10.14.
Per pound in comparison to 2025 with a coast-wide average of $8.18.
This graph provides you with a look at the average price from the year 2000 to the year 2026, noting that these average prices have been adjusted for inflation. So while we're pretty up in price right now. It actually is kind of interesting to look back, and I wasn't around in 2011 doing this work, but it is interesting to see the trends and note that there was a point in time where price was in a way comparable when we consider inflation.
And now this table shows the Pacific halibut sales by IPHC regulatory area, noting overall we saw a total of $3,584,789 in revenue, overall revenue for the 2026 FISS in comparison to 2025 where there was $2,063,371.
Two things of note here. One, obviously, yes, SALP the prices were considerably higher. We also did a little bit more work in general, and the work was distributed differently as well. We did not complete work in 4B in 2026, nor did we complete work in 2A.
And with that, I would just ask as a wrap note, um, the FIS paper that provides a summary of the design and implementation of the IPHC Fishery Independent Setline Survey in 2026, and I will gladly take questions. Thank you.
Hey, this is Scott online. Okay. Can you go back to slide 10, please? Yes, I can.
Here we go. Yep. Okay, so am I wrong, but should 2C, the total, equal 12 and not 8?
Yep, sorry for that. Yeah, ultimately, yes, though, that is correct. Uh, I will get that fixed for future presentations, but ultimately, yeah, there was 25 stations total.
Thank you. Okay, thank you.
Thanks, Kayla. No other questions? Last chance. I'm still here. I'll be here.
I just—. Yeah, and then I will physically be there tomorrow as well. Thank you. Thanks a lot. Okay, let's move on to Paper 08, and Dr. Webster is going to present.
Okay, good afternoon. I'm Ray Webster. I'll be presenting on the upcoming designs for the survey. You've seen Kayla talk about the survey we did in 2026, and I'll be looking forward to the next 3 years and maybe a little beyond that.
Okay, um, quick overview of the FIS. Kayla's already done a lot of this, but it's our most important source of data on halibut. We use it for getting our indices of density and abundance. Which give us trends in the stock and estimate the stock distribution and provide an input into the assessment. We also use it for biological data, and we've had annual visits undertaken every year since 1993 with a couple of expansions, and then one in the early years of the survey and more recently the previous decade.
This, uh, the orange dots here represent the full FIS grid of 1,890 stations from Northern California out to the Western Aleutians and the Bering Sea shelf edge in U.S. waters. And we also, as well as the data from our own survey, um, for understanding the stock in the Bering Sea, we make use of, um, data collected on the NOAA trawl survey and also Alaska Department of Fish and Game um, survey, which, um, both of which are typically fished every year, um, though we've had some gaps in coverage in recent years.
No audio detected at 1:04:20
Um, Kayla's already talked about the objectives for the most part. I'll just quickly touch on them, that we have a primary objective, which is sampling, um, the stock for assessment and distribution estimation. Um, a secondary objective, cost-effectiveness without compromising scientific integrity.
And tertiary objective, minimizing removals, assisting others, and so on. And each of those objectives impacts the design of the FIS.
Reviewing the designs over recent years to provide some background for where we're going. In 2020, we had a rationalized FIS design following the expansion, recognizing that we can't sample 1,890 stations every year. We have to prioritize where we're putting our sampling and, um, how to, to change that from year to year. And so we planned for random sampling of stations, a subset of stations in the core of the stock, 2B, 2C, 3A, and 3B, and some kind of block design elsewhere. And we were only able to fish the, the core areas in that year due to COVID-19.
Um, the following 2 years, the design was largely implemented as proposed, except for Western 4B was not sampled in 2022 due to lack of viable bids. And as yet has not been sampled since 2019. We had reduced designs the following 3 years in order to lower costs, with little sampling outside the core in 2023 and no sampling in western areas that year. For the reductions in 3A and 3B in '24, but some sampling in 4CD along the shelf edge. And in 2025, we had sampling in 3A and 3B that complemented what we had sampled the previous years, and we sampled higher density parts of 2A and 4A, 4B for the first time since 2022.
As you saw, we were able to increase our fish footprint in 2026 relative to those years, including 10 charter regions not fished in 2025, um, trying to make the design as complementary as possible so we can cover as much of the habitat as possible in a short time period. We fished 4A stations in Southeast Aleutian Islands that had not been fished since 2019. And we had no sampling, as Kayla noted, in 4B due to a lack of vessel bids.
So the figure motivated by comments from this very body a couple of years ago, this is showing the most recent sampling year by station with the lighter colors representing those most recently sampled. So the yellow color is other stations fished this year, going into orange, those are stations that were most recently fished last year, and so on until we get to the darker purple color, which are stations that have not been fished since 2022 or earlier. So if you put together the orange and the yellow, we've got pretty— and the, you know, darker orange perhaps, we've got Pretty good coverage, very good coverage generally in the core of the stock from 2B out to 3B and even in 4A over the last 2 to 3 years. Patchier coverage, particularly in 4CD and 4B.
And Kayla's already shown you a version of this, this is the implemented 2026 design, simplified a little bit. Showing the— what we actually did and what we missed.
So, moving on to designs for 2027 to 2029, our focus is on what we call the base block design, which we've evaluated— we evaluated a few years ago for the Commission's consideration. It prioritizes some annual sampling in each biological region for stock assessment purposes, ensures all charter regions in the core of the stock are sampled over a 3-year period and coverage elsewhere is prioritized to minimize the potential for bias and maintain relatively precise estimates.
And the sample blocks are rotated over time, and the base block design is considered the optimal long-term fish design in terms of balancing scientific needs that we have good coverage over a relatively short number of years, and cost-effectiveness. Fishing stations in a block design rather than, say, a randomized subsample of stations is more operationally efficient.
So these are potential base block designs for the next 3 years. And so it gives you a sense of how the blocks, the— in the core of the stock are just charter regions. Are rotated from year to year. So from 2B to 2C, 3A, 3B, we cover all stations over that 3-year period in those 4 areas using a rotational process. Basically, in 2B and 3A, we have almost all stations, I should say, the exception of the stations in the inside waters in 2B, in the Salish Sea, Strait of Georgia, and which we caught virtually no fish the one time we sampled in the 2018.
They're considered a low priority for resampling. Um, so we rotate those, um, basically alternate which charter regions are fished from one year to the next, um, with a little bit of variation. In 2C, we fish 2 charter regions each year, which means the central charter region of Omine is fished every year. And in 3B, with— there are 5 charter regions, and we complete them all over a 3-year period.
We're looking at variations on that for possibly revised designs to be presented to the commissioners soon.
So these— I mentioned these are potential base block designs. They will be impacted on the ultimate design that is selected for 2027, which is under consideration by the commissioners at the IM meeting coming up. Very soon. So, depending on what is approved for 2027, the designs for 2028 and 2029 may vary from these. Likewise, to complete the picture, this pretty much covers everything in the range of Pacific Halibut that we survey.
These are the base block designs for the following 2 years.
So, our secondary objective is cost. So we do a cost evaluation on upcoming designs, in particular that focus on the 2027 design, the design for next year. And we projected costs with a series of assumptions or design parameters. The designs are optimized for the number of skates using 4, 6, or 800 hook skates depending on projected catch rates and bait costs. Different numbers of skates are more cost effective in different areas.
Projected Pacific halibut average sales price 2027 is assumed to be unchanged from that 2026. And the landings per station also remain unchanged in each charter region from the most recent FIS values based on the last time the region was sampled. Cost projections also build in the, the actual cost of chum baits, which have already been acquired for 2027, $4.09 per pound, up from $2.40 per pound in 2026. And this is 70% increase in, um, in bait costs, and it has led to a revision upwards in our projected costs for the survey based on the relative to the preliminary projections we had presented to the scientific review board and the commissioners earlier in the, in the, a couple of months ago.
So, um, the base block design you just saw before, we consider this option 1. And just to go over what we're looking at for next year, we're looking at revisiting stations in 2A that we haven't fished in some time. We typically focus in 2A on the areas of higher density, um, and but we, um, that it's important to go back to, to all areas in case we see changes that we would otherwise miss if we didn't sample them, um, even infrequently. So in, in 2027, we're looking at Northern California, Southern Oregon, um, and, um, Central and Northern Oregon coast, and a few stations off the south coast of Washington. This includes some overlap with stations that we fished a couple of years ago.
But it provides a sufficient number of stations to maintain precise estimates for that regulatory area. 2B, we have the St. James and Charlotte regions of 2B, the southern two-thirds of 2C, complementary charter regions for 3A from those we've fished most recently, and two charter regions in 3B.
We've also got the Ati region in 4B, which is a region we have not sampled since 2019. As I mentioned earlier, we tried to put it to bid in 2022 and got no viable bids that year.
We don't know if we'll do better in 2027. It'd be nice to see how things have changed there. And also bring in stations in the southern shelf edge of the Bering Sea, including St. Matthew and the Pribilof Islands. This design is projected to have a net revenue of -$533,000, and the income expenses are also noted on the slide.
So we presented with the Commissioners at their work meeting and to the SRB recently series of modular add-ons to that design with a number of goals to reduce the projected net loss of the FIS in 2027 with a couple of— at least at the moment, one additional charter region that is projected to be revenue positive that could offset some of the losses, catch up on FIS regions that were part of the 2026 base block design that we saw earlier that were not fished. I mean, it is in the design that you saw earlier. Reduce the heterogeneity of revenue among future years by sampling, by bringing some areas forwards from the planned years. At the moment, we have those base block designs I showed you for the coming years have quite variable costs, jumping from losses of a few hundred thousand dollars to well over a million dollars. Depending on what areas we fish.
So bringing some areas forward in time may allow us to balance those costs a bit better in future years.
Because 4B is so challenging to get bids for, we have an option that sets a fixed charter rate at a higher value than we've actually ever had for 4B in order to make it more likely that we get somebody bidding on that region.
And to fully clear the backlog of uncertainty created by reduced designs, again, by fishing areas that we may have not been able to fish in recent years.
So these are the, the options that we were considering. So go through them. Option 2.
Colors are a little less distinct on the screen than on my computer, but this is Shelikhov in 3A, which is an area that we had as part of the design, I think last year, but we weren't able to have the resources to do that. So bring that and sample it in 2027. Options 3 and 10 are the Adak region in 4B split in two to maybe make it a little— give a little more flexibility for bidders if they want to bid on all or half of that region.
Option 5 is bringing forward the Alaska region in 4A to help balance costs in, in future years. 6 Is Central Shelf Edge in 4CDE. 7 Is the Northern Shelf Edge in 4CDE. So, we— if both of those options are selected, that would mean we'd be fishing the entire shelf edge in 2027. In the 4CD part of that.
Option 9 is essentially completing all of 2A in one year. And Option 10 is that— expands the footprint in 4B but has that fixed charter rate to make it more appealing and try to get as much as we can done with 4B. And that again would also be as part of the base block design. We have that western illusion part of 4B as well. So that would be almost all of 4B if we had Option 10 approved.
The Commissioners have— the US, sorry, has agreed to voluntarily provide additional $749,000 in supplementary funding in order to fund modular options 2 through 7 as add-ons to Option 1. So this would leave out— I didn't mention Option A, which was Sitka, which was a revenue-positive option that would offset the costs elsewhere. So the commissioners have focused on options 2 through 7, and so there will be further discussions on those at the interim meeting.
Since that amount was initially intended to fully cover those options, that based on preliminary projections and given the base rate price went up considerably since those projections were made, this does fall short in covering those options, so there's still a resulting operating loss.
So adding those options to the base block design gives us this design, which is considerably more extensive than anything we've done since— probably since before COVID Guessing, sounds about right. Um, 1,025 stations fishing in all IPHC regulatory areas, including, um, a high footprint in 4B, um, extensive sampling on the 4CD shelf edge, and, um, the, the stations we want as part of the base block design elsewhere.
That with the including the, um, supplementary funding that would result in a net loss of $614,000, which at the moment is something that could be covered by this reserve fund without additional— the need for additional supplementary funding. Ah, that was it. Okay. Yes, so point of this presentation is to let the RAB see where we're going in coming years, particularly the 2027 design. This looks to be the direction the Commissioners are going, but there'll be discussion obviously at the interim meeting where we hope to get a design approved, and hopefully it's this design.
No audio detected at 1:19:40
No audio detected at 1:20:00
And then we have the hard job of getting— ensuring that all of this gets done, getting successful bids for areas like 4B and 4A, which has proved challenging in recent years. Um, yep, looking at the Option 1, I think it was, or just even this block design, um, there was discussion earlier about south of the Oregon border, the California area, and I see some 40, about 40 stations or 40 sets down there. Is the amount of— since we've got the California Hallow, but I probably predominantly in there and where it's a revenue-based return for the, for the sets, correct? And is it prudent, or would it be something that we should consider, of eliminating those sets south of the predominant Pacific halibut areas based on the revenue versus the cost for that survey? Would that skew your research too much?
I guess what I'd be saying is, is it cost effective to be setting and surveying south of the Oregon border in California? Well, we look at cost effectiveness on a broader scale than just individual areas.
So 2A is never going to make us money. Any part of 2A is revenue negative, but we still need to get information from that. And the northern California stations that are highlighted there have caught, you know, by 2A standards, reasonable catch rates of fish, comparable to parts of Oregon in particular. So, and we haven't visited those stations since 2017, and so things could have changed in that time. So there are halibut there.
We haven't visited them for a long time. We we do incorporate all of the halibut, all of the habitat down to San Francisco Bay in our modeling and in our estimates of trends and so on. So regardless of whether we sample there, we're estimating something there. So it is scientifically valuable information that we'd be collecting by going to those stations regardless of the cost. We know it's expensive, but we haven't been there for a while, and Cost can be part of that, how frequently we visit them, but it's time.
It'll be a putter in 10 years. Further south of that, I think we caught 1 or 2 halibut when we sampled those purple stations, and halibut have been detected as far, I think, on the Observer Program, as far as Morro Bay. It's 1 halibut once upon a time, and we're talking about Pacific halibut, not California halibut.
So that they, they can venture further south with changing environment and water conditions. It's a good idea to keep an eye on things. I'm not sure when we go back to those stations, purple stations there, but it might depend on what we get, on how things appear on the California stations that we get next year.
What's the earliest someone could start out in 4B?
The earliest? Well, our survey starts at the end of May, so that's— you've got flexibility. The charter operator will have flexibility to fish when it suits them within that window. The latest is September 15th.
Sounds like you're interested, Brian. I mean, a little bit, maybe.
Um, you mentioned, uh, the highest rate ever per station. What are we talking about?
Ian devised this. It's like, I would say, over $5,000.
$5,000 Per station? Correct.
It's probably worth pointing out though, the commissioners did not endorse that option, so at present it still would be subject to the normal bidding process.
Thank you. Yeah, but that being said, we do need to see a number that would— what it would take to go out there to fish it. So I mean, we want to see bids there. Don't be reluctant to bid because you think it's too high, right? I remember throwing out a number about half as much as that and having it thrown out a couple years ago, so that is a pretty substantial difference.
That would definitely make it a lot more attractive.
Okay. Did—. Did—. I have a couple of questions here. Did 2026 operate at a loss then?
No.
Okay. The last, last question is— it's not really a question. It's more just a comment. I talked with Kayla. About bait during the season.
She called me up and she asked me how things were going with, you know, are you able to find chums? This was the hardest anybody from Seattle has ever had getting chum bait. I mean, we had kind of a loose deal with Trident over the last 3 or 4 years where we called up their plant manager and asked him to put up on the order of like 50,000 pounds of H&G chums for us. And he's like, oh great, that's No problem. And because you're buying so much, we'll give it to you at a discount.
And that's— that guy is not there anymore, I think, because he lost a bunch of money for them. I think you guys probably caught on, they're selling chums as food now, so you're paying food prices to buy chums. I was really— I've always fished with chums when I do my own fish, in addition to some other species, but I always like having chums on board, and it became It got to the point where I couldn't find it. No one would put it up for me. It seemed like it was a sensitive political issue as well, especially out in the Shumigans and Area M. I was able to call up— False Pass did it for me.
I leveraged a future trip with them putting up 6,000 pounds of chums for me. So I said, I'll sell you a trip if you get me some bait so I can go. I think I sold them a black cod trip. So I could go halibut fishing. It might be worth pursuing.
It's not going to help you with this year, obviously, and I don't know how this affects your own, like, rules and regulations surrounding, like, people buying the fish, but it might be worth putting in something into your bids where it's like, if we sell you fish, you need to put some bait up for us next year. I mean, if you're thinking about selling to Westward Seafoods or False Pass on a trip, and False Pass is willing to put up 5,000 pounds of chums for you at $1.85 for the next season, like, that could save you potentially a lot of money. So maybe that could help you out for 2028.
Thank you.
No, have you guys used nothing but the Pacific Surveyor on the West Coast for the last 100 years? Is that right? 2011, Yes, the only vessel that's fished 2A since 2011. Sorry, um, they're the only— yes, you're correct, the only vessel that's fished 2A since 2011.
Is there a reason for that? Like, I don't believe anyone else bids, do they? Or, uh, we haven't— we haven't had any other American boats that have been down there, but we have had, uh, interest from Canadian vessels asking about that being an option. Um, and we've run into hurdles with the permitting, but that doesn't mean it's impossible. So, that's, if need be, that's something that we can try to figure out.
And if Kayla wants to add more, she can.
Yes, thank you, Tyler. Ultimately, the Pacific Surveyor for several years has been the only vessel that has provided a competitive bid, whether they be US or Canadian vessels. They are the only vessel that has provided a bid that was viable. For us to complete the work.
That does not mean that we have, like, we— that we have— we're not necessarily selecting them because we have— we want to have the same boat. Obviously, it would be much more preferred if there was more vessel participation in 2A. It's just been a matter of either nobody else bidding or nobody else bidding a competitive bid.
Yeah, go ahead. Um, I had a couple questions.
Um, the east side of 4A.
There was, there's a lot of maps, but it looks like it was fished this year, 2026, but it's not on the schedule 27, 28, 29, 30, or 31.
It wasn't. Prior to this year, it had been an area that had quite low catch rates, and so it wasn't something we were targeting for as frequently to be fished compared to Western Foray. I've just in the last couple of days developed some revised base block designs for coming years based on the assumption of the supplemented base block, this design going forwards. And I have brought it— that Foray, I think, trying to remember, either put it in 2030, I think. Or '31.
It's more recent than— yeah, it's, it's now part of the design. We had good catch rates there this year and contributed to what we estimate to a positive trend in that area. So it's, it's an area that we think we— I think we need to visit more frequently than we have.
Thank you. Um, and I just wanted to, I guess, note for the I don't know if this is the place to do it, but that when I first got on the RAB, I think that year, maybe the next year, was the first year that it was like moving away from being a randomized survey design. And I remember that year this body had a lot of comments about that being, um, not good science and urging the FIS to try their best to move back to a randomized design. So I would like to continue that comment, I guess, that statement that not randomizing a survey is really problematic. So I think it would be nice if that conversation was continuing, that at least, I mean, I recognize there are issues all related to money, Um, but I think it's really important to try to do a randomized survey, so I just want to put that on the record.
Um, and then my last comment was just— I'm kind of silly, but it, um, I don't know if it's possible to make sometimes the maps of the areas or put them on a slide by area so we can see the last couple years and the next couple years by area. So we don't have to flip through pages so much to get—. It's—. I know it's probably more work for you guys, but just to look at like the trend over time in a specific area, because a lot of us are like, oh, what's going on in 3A or what's going on in 2C? And so just to be able to see those changes.
So something like this is really helpful. And even to just break it down by area or add 26 in there just so we can kind of see trends over time. And yeah, it's not a huge deal, but anyway, that's all I had.
I just quickly note that Angus has a question online as well. Angus?
I didn't actually know my hand was up. Sorry, I didn't actually have a question.
Oh, sorry about that. I think that's been up for a while. It has. No problem. Ray, any initial response?
Certainly with the map question, yeah. That might be something that— I mean, it would take up too many slides in a presentation, but I could put it as extra slides so you can look at that kind of thing at your leisure. Not hard to put that into a report, I guess.
I mean, I could talk about the randomized design. As a statistician, I much prefer randomized design, but the commissioners are pretty set on this base block design as a combination of efficiency and scientific needs— fulfilling our scientific needs. It does maintain precise estimates, but the main concern with non-randomization is bias, and so we have assess that. And yeah, a design in any given year, there's going to be some amount of bias by not sampling an area and just projecting what it is based on what we most recently sampled or what was sampled nearby. But by sampling frequently enough, we keep that bias in check.
So if all stations are sampled over a relatively short period of time, then the the amount of bias should be relatively low. And we base that on how we've looked at the past time series. And it used to be, at least a couple of years ago, I had a slide on that, on how large changes are from one year to the next or over a 3-year period. And they can be quite significant over a 3-year period by area or even coastwide. But so sampling at least at that frequency is important.
But Ian's got some comments. I just want to note that one of the, one of the contributing factors to moving from the randomized design that we had to the base block design was actually pushback from our charters saying that they didn't like the additional running time, the space between stations. We were needing to sample at a rate that was far enough below 100% that it ended up being a lot of days of only 2 or 3 stations in some areas, particularly— and I don't think we ever suggested a random design in the very ends of the distribution. I mean, in the Aleutians, you could have a setup where you might only be able to sample 1 or maybe 2 stations a day for most of the charter. So that was— it's a combination of feedback.
Like Ray, I also like like a randomized design, but because of the geographic spread of 10 nautical mile stations, that does create some challenges for us. We did have other options proposed, such as randomized clusters. The stations were groups of 3 or 4, which is a fishing day. Sorry, I'm too far from the mic. Yeah, randomized clusters of stations.
And so that, you know, removes the— possibility of bias because of the randomization, but keeps things operationally efficient. That got no traction at all. Nobody even really wanted to discuss it. So I, I really recall this conversation that in the— us, our concerns back then as the board, and just to revisit that a little bit, it was discussed with us that that it had kind of a, for lack of better words, a stink to it if the research is being funded by the SETS to where the blocks, rather than have a random model to be used, that it had the inference that the prime areas were being fished at that time. And the, the opportunity to fish those areas was being fished first, if I understand, prior to the season.
And I think that was the inference part of it and part of the discussion, if I'm— if I remember correctly, that there was a kind of a fair chase kind of thing. If the halibut research is being funded by these sets and they're just taking the low-hanging fruit, so to speak, um, that we didn't want it to be looked upon that way from the industry, that if we went to that block model— I understand more so about the charters that are hired to do that and how it costs effective-wise, you're not working at such a large area. But that was, I think, the gist of our conversation back then.
So I think I was actually probably responsible for a fair amount of the comments you guys got about not liking randomized designs. When we started doing surveys on the Polaris, I think the first year you guys just let us do 3 a day. The next year you let us do 4 a day and we just busted them out. I mean, it worked great. But then when things were random, when there was a hole in the middle of the chart, it, it made it so we couldn't do you know, for that day.
It has since changed as well. Like, I think back then we were doing 6 gates, and I think when we did Seward in 2020, we realized after the first day, if we're doing 8 gates, it doesn't matter how close these stations are together, we're not gonna be able to do 4 in a single day. I think we finished at 3 in the morning, and then the port sampler from Sitka was like, this is not, gonna work for me, and it wasn't— we just, yeah, we shook a bunch of gear the next day, so we had to do 3. So I mean, I could see doing a randomized design in an area where you do have 8 skates because you're not going to be able to do 4 anyway, but I guess you do want to try to preserve the ability for if you have good weather, if you have good tide, and you're not doing 8 skates, if you have the ability to keep things grouped up so you can get 4 stations done in a day, I mean, that is 33% more stations in a a day than if you're doing 3. So you guys want as much data as possible.
That is something to consider. I understand Lauren's point too, because I got a scientific background, and if you start picking and choosing, it gets further away from the sort of science we're after. But I think, I don't know, finding that balance with efficiency and scientific integrity is pretty difficult. But I just wanted to own up to— I made some of those comments about not liking the randomized design. I'll point out we're not the only agency that, that doesn't sample everything every year.
Some other agencies rotate which stations they fish. We have NMFS doing the, the sablefish survey, Aleutian Islands versus Gulf or whatever. Other— 2B has some surveys where they fish north and south in alternating years and then get a complete picture over a short period of time. So, yeah, it also might be helpful, helpful to just, just to separate the discussion of doing it in charter regions versus how you select those charter regions. So doing it in charter region blocks really is a logistical feasibility, makes it easier.
A vessel can bid on a bunch of contiguous stations. The choice to do a charter region more frequently than we would have to in a purely scientific design, that's, I think, a separate really a separate topic. And the commissioners, at least this year and what they've suggested so far, have moved away from that, and they're actually bypassing charter regions that we know are revenue positive but we don't have to have this year in order to sample the ones that we do need to have. So I think we were certainly in that situation a couple years ago. We were in a financial bottleneck and had to sample those areas, but that, yeah, that's actually not part of this design this year.
This design this year is purely a scientific design. It's just a randomized block design rather than a random station design. Sorry, not— I shouldn't say randomized block design. It's a charter region block design that will be rotated over time as opposed to a randomized station design.
Yeah, that ties nicely into exactly what I was going to say. I mean, we came through some periods where We did adjust areas for budget, and that became a contentious issue because it wasn't really acknowledged. Then it finally got so dire that, yeah, okay, yeah, we did choose areas based on revenue. We did it before they admitted it. But anyways, um, so I don't think anybody anticipated we'd come back to revenue neutral quite so quickly as we have.
Right now. And we're going to hear about this in January anyways from everybody. It's a hot topic, right? We fish in 8 skates. There's no reason to fish 8 skates in any of these regions except to catch more, to make more money.
And, you know, the 3C, 3B guys are always, you know, kind of grousing about it. The Canadians are going to grouse about it, that those areas get hit every year, year after year. And never miss because that's the money-making areas. And there is going to be some pressure, as Ian said, to push off of those high-revenue areas because we don't have to go for the high-budget-generating ones.
So I think I agree with that. I mean, you're right though, on 8 skates a day, there's no way you can go more than 3 a day, absolutely no way. But with 6, there's days, lots of days, you could get 4 in. You know, if you, if you want to get the bids lower, you'll get the— you know, in areas where you don't catch a lot of fish, the revenue isn't a huge deal of it. If you could fish less gear, you could get the station done lower, and that might get your stations done quicker, and that might get your budget down, right?
Um, and then on a completely unrelated thing, I don't know if this is a place for that question, but there's some complexity that I don't remember and really understand on the 4 CDE bidding where we're choosing that area because of the trawl survey, some kind of turf war with the trawl guys up there. Can someone explain that to me, what's going on up there? Nobody wants to bid it, but we force somebody to go do it because we're keeping the troll guys. Uh, can someone under— someone understand that? I know it's there.
We could get Heather in here and she could explain it all to us.
I mean, I'm not exactly I'm not sure what you might mean, but a few years ago we had— the commissioners added— let's see if I can find it— stations in 4C that originally were these ones here, 2024, were— they were going to make it a more expensive survey, and I guess we didn't have the It created a larger loss, but there was some pressure to get information from that area in particular for— because it informed not just our own understanding of the stock, but also is a component in estimating an index for abundance-based management in the Bering Sea, in Yeah, Bering Sea, Aleutian Islands. And so I believe that was part of the discussion. Dave might remember it better than me, but I think that might be what you're referring to, that, you know, good for us, we got some extra stations and some information that we might not have got. But it wasn't— there was no negative to us or to anyone for doing that except perhaps some, some, um, greater costs on the survey. That was the commissioner's call.
No audio detected at 1:44:40
There was more to it than that. Anyways, uh, Just trying to learn a little bit more about it. Uh, there's something to do with the guys out there are all just fishing around St. Matthews right now anyways, and, and the only reason that we're surveying all over that area is because We're trying to— we're in some kind of a turf war with the Amendment 80 guys or something. Is that true? I can't remember what all the detail was.
I, I—. It doesn't come into our, our designs. I don't know anything about that. We, we're proposing sampling in the shelf edge because we want to know what the trends are on the shelf edge. It's an area that historically had very high catch rates, and you're right.
People are fishing around, say, Matthew, because the catch rates are higher and it's not worth their while going to the, to the edge. But it's still a large chunk of real estate, and we want to know what's going on there.
The IPHC survey in that region is one of the measures in an index that sets the level of prohibited species catch or bycatch that the Amendment 80 fleet is allowed to get. So the fewer years we have an input for that, they'll fall back to older data because that's all that there is, and that might have been a period when there was a higher abundance. So it's, it's not necessarily like grounds preemption or turf war so much as like, I think it's, there's a lot of pressure for fishermen, U.S. fishermen, to get as recent data as we can out there so that we can provide a realistic input for the, for the index there for for setting the bycatch levels because maybe right now, you know, there's some feelings that those bycatch levels might be too high based on actual abundance. Thank you.
Just follow up, if I understand correctly, then which kind of makes more sense now to me that before we used to be on a random dice set. Now the, the, you've kind of melded that, melded and compromised a little bit. And for the, for the benefit of this, of the integrity, I guess, for lack of better words, the surveys were at a randomized block. So the blocks are random. Not—.
You don't get to pick what block you're going to do. You have a random model where, okay, the computer kicks out that these blocks are going to be our set survey for this year. Is that correct? Not quite. No, there's no— actually, no randomization.
The blocks are— see, that would be a way of doing it.
But, um, I don't think it would be the best way of doing it because there's too, too likely you'll have big gaps that persist when you have a small number of blocks. Now we're, we're, as you can see, like 2027, we're fishing, um, say look at 3A, we have, um, 2 charter regions fished here and 2 here, and then the following year we alternate to the other remaining 4 charter regions and in 3A, 3 here, 1 here. And so over a 2-year period, we complete the entire 3A survey. We'd love to do that in 1 year. We don't have the resources to do it, so we split it in half.
And so there's no randomization there. It's—. We could have picked these blocks in a different way. One of the things we try to do is have 2 adjacent blocks, charter regions, to allow people to bid on 2 adjacent charter regions. Is maybe more appealing to some, some vessel operators that otherwise aren't— it's just the goal is to complete the stations in a shorter period of time.
And, and in 2B, 2C, 3A, that's a 2-year period. 3B is currently over 3 years. So if I hear you correctly, then the fear of it is if it's a total random model that some areas would never get sampled just because of the luck of the draw. It wouldn't—. Yeah, they wouldn't be maybe never sampled, but you get some areas that might be sampled 3 or 4 years in a row just by chance.
And, um, yeah, there are definitely some drawbacks to a fully randomized design, and that's why, you know, some— even a randomized design like we had previously, it worked because we had a high sample rate, which meant we had good coverage. But when you have a, um, smaller number of stations to work with, people often stratify it so that they ensure there's some samples here, some samples here. You got spatial coverage, because randomized designs can give you a bunch of holes as well.
So, sorry, I actually misspoke earlier when I said randomized block design, but that's not what it is, and Ray's cleared that up. But I do think there's still— there's a perception that we're sampling more frequently in areas with more biomass, and that's true. If you think about our goal, we're trying to minimize the potential for bias. We don't want We don't want the population estimate to change too much while we're not looking. And that can happen in two ways.
It can happen in an area of low density. If we leave it for a really long time, it can drift away, and eventually that's going to be a meaningful change. But in areas with a lot of biomass, it doesn't have to drift very far before it's a meaningful change. So we do actually need to sample areas with more biomass more frequently. And that's why you see, for example, we haven't sampled the inside waters in BC since who knows when, and we don't need to again anytime real soon because there's almost no fish in there.
We will eventually because over time it could drift away, but places like 2C, northern 2B, we need to sample those much more frequently because right now that's where most of the biomass and the stock is, and so we can't leave them very long without the potential for that estimate to drift up or down and create bias in our design.
I was curious about the supplemental funding. Is that— that's great. Like, is that something that might be possible in additional years to help with the cost of the survey, or it's kind of like a one and like just to help us out one year? We were in dire straits kind of thing. I'll pass that on to Dave, but this is not our first year of getting supplemental funding.
Sorry, I was distracted by a fire. Can you—. Would you restate? Sorry. Oh, I was just curious, like, that supplemental funding is, is great that it allows us to have a more comprehensive survey, and I was just curious if that was, um, something to possibly count on in the future, or just like a one-time thing to help us out, or how that worked.
Yeah, thanks, thanks for the question. Uh, the short answer is that we, we can't count on it, and it's, and it's been communicated very clearly that that's the case, um, that these are one-off, uh, and it's been multiple years of these one-offs, um, supplementary funding based on highly unusual budgetary circumstances within DFO and State Department. Um, we are going to be discussing at the upcoming Finance and Administration Committee an alternative whereby the Commission would put in additional contracting party contributions, standard contributions for the Fishery Independent Setline Survey each year. However, that's very much a discussion in process and it wouldn't be anywhere near the levels that we're currently receiving in supplementary funding. So, so I think we need to assume that for 2028, for example, that we would be operating with zero supplementary funding at this point.
I didn't draw attention to it earlier, but we have a goal of a FITS reserve of $4 million. So that's money in the bank that we— if we have a year in which we— things are expensive, we can cover that. Through money that we've, we've accumulated. And I believe we managed to accumulate a fair bit of money in 2026 to go towards that reserve.
$4 Million.
We were just disconnected for a few moments. I think we're reconnected now. Could we just have the agenda up on screen, please?
Okay, so in terms of the schedule, we have— we had the whole afternoon to discuss additional guidance and discussion of other potential applied research projects, but we've sort of been doing that as we've been progressing through a number of the papers and presentations from today. So what we are going to propose, that for the next 23 minutes we do continue on with that sort of general discussion. If you have topics that you'd like to raise and discuss with the team, and then we'll adjourn sharp at 4 o'clock, head over to the function venue and continue discussions informally. So for the next 22 minutes, I'm going to pass to Giuseppe to see if he can facilitate just general discussion on some of those research projects. Over to you, Giuseppe.
Yeah, thank you, Dave. Yeah, no, as Dr. Wilson said, we already covered a little of the discussion, but we still have some time that, you know, we could spearhead the discussion that will continue tomorrow morning. On the same vein where we were lastly discussing the FIS, if there's any other issues that you guys want to raise up regarding FIS or any other research projects, that's really what this discussion is for. So go ahead and speak up. Kevin.
Last couple sessions we spoke to and about exploring if there was a intern at the college or something that would be interested in doing a data mining of the trawl activity of the shrimping industry and the drag boats in areas, especially in 2A, that are on a scheduled openers and stuff, if there was any correlation between activity in those areas and the low catch rates or the catch rates of the halibut fishery during that time. I just wonder if there was any I think it was, if I remember correctly, in our last meeting that was going to be at least proposed possibly. I don't know if there was any movement on that or if we had any, if it got dropped or if there was any interest in doing that. Still getting that comment from Lisa Fleet in Newport where, and there was even a little bit something even In addition to that, that happened this year is we had the hake processing boats right offshore dumping tremendous amount of their waste product into the Chignik grounds and stuff. And so there's concern that that activity in the areas, especially they're so limited as to their days, is maybe there's a correlation, is or isn't a correlation, if they could show that there's any impact on the fishery.
Yeah, thanks for the question, Kevin. Yeah, we noted that comment last year. We didn't have a chance this year to provide that project for the interns. This, this last year, as in previous years, we've had 2 interns, and the projects were assigned, you know, based on their own interest and also on things that we could actually have data on on hand, so we opted for providing, you know, guidance on projects that were a little more riper, more ready to be implemented. This— interns are with us for about 3 months, but they really spend their time working on a specific project for about a month and a half.
No audio detected at 2:00:00
But this will definitely be considered for the next round of interns. We just need to gather the data first, because if it's just a gathering, data gathering, there's not going to be time for analysis, and that's really what we would like to do. But we take note, and we'll try to push that as a potential project for an intern.
Thanks. Ian? Well, just on that topic, Kevin, you may know already, there's actually research from either the '80s or the '90s on sablefish diets actually showing that at that time, they were measuring hake offal, hake heads basically in sablefish stomachs, and that it was a pretty big contributor when the hake fleet was there. We might be able to find some of that historical, those historical studies. Yeah, I guess our concerns are is that it would be like going into a forest that's had a, bunch of people walk through it and then try to find a deer.
You know, if the drag boats are going through the predominant halibut grounds and scattering the fish, the fish aren't going to stay there. They're being drug over or fished over, and then hard to catch a fish that's got a full belly full of egghead.
I will just add that we did try to look, uh, in a very preliminary way what is available on that topic, because that was one of the requests. Unfortunately, the largest limitation is just no data accessible directly to us on troll activities, especially on a scale that would allow us to closely match the timing. So we found some troll activity data, but it's a year average, which doesn't give us the granularity that would allow us to look specifically like overlap with the direct openers timing. So that, that was the largest challenge. Uh, if we had that data, it would be probably easier to, to get like, for example, intern to work that.
So yeah, the data limitation is the largest challenge there.
Or it might be more with the NOAA fisheries. Uh, it's not available necessarily directly to us and the granularity would be a challenge even to request it from the fishery since it's not the direct fishery that we are managing.
Any further comments from any of the RAB members regarding, you know, the issues that we discussed at the beginning of today's regarding the status of the fishery? You know, we noticed that there were some commonalities among which, you know, the prevalence of smaller fish, I think it was highlighted by several of you, the patchiness of the fishing. Is there anything else that you guys could like to share with us in terms of your observations or interpretation?
If not, if you have any comments regarding any of the topics that were presented here today before the, the FIS data, including the Sanfley study or any of the four research topics that were presented before.
I don't know if this is in line with that, but I was curious, just with the fish, I was curious if the IPHC had done a study on different baits, just in case chum salmon becomes less and less available or too expensive, if they've, if you guys have already done research if you need to use other baits of what might have a comparable catch rate. I was curious if that's something that's been looked into before or of interest. Yeah, yeah, we have actually. I don't know if Ray is here. I don't know, he may be online.
If not, maybe Ian can fill it in, but we have done those studies. Yeah, I can speak to that. Ray will remember more of the details, but we did a bait study back in 2012 and we compared chum and pink salmon and pollock. And in a pilot study previous to that, we tested herring as well. It didn't make it out of the pilot study because herring didn't stay on the hooks well at all, at least given the way in which our survey operates.
Then a few years ago, we— a few, was it 2 or 3 years ago, we integrated pink salmon in, and we actually calibrated it for this very reason, because it was a lot cheaper. And in a nutshell, it worked okay in, in 2C, where pink salmon are fairly common. And the farther west we went, the less well it worked, to the point where way out west it worked so poorly that we actually, even though we saved money on bait, we lost money because we caught fewer fish. So pink salmon was kind of a net loss for us. We have the ability to calibrate in new baits.
We've considered squid because that's pretty frequent, common for sablefish fishery, but, um, you know, our preference would be to stick with chum because we know it works well. Uh, but we do have the ability to calibrate in new baits. The, the challenge being there is a trade-off between the catch rate that that bait provides and the cost that we, that we spend I did a little talking with some of the plants this year, and I don't know a lot about the Southeast salmon hatchery fish, but I hear that sometimes they just roe strip the fish and then they throw it away. And it was to the point where it's like, well, that's still a pretty valuable product as far as like, I'd use that for bait. So the problem that we ran into when talking about that issue with plants was just like, okay, who do I talk to?
No audio detected at 2:06:20
Who's willing to do this? And I think ultimately it boils down to who's going to freeze it for you and where are you going to store it. But I don't know, I talked to Trident. They were unwilling to freeze chums for me there. I was like, okay, well, you got a plant in Valdez, you got plants, or is it Valdez or— I don't know, they got plants somewhere else.
Can you talk to someone from your company over there that, you know, maybe you guys could freeze some of that fish that you're throwing away or grinding up for fish meal and ship it out here? Because we, you know, there's a lot of people that would buy it. I don't know if that's going to qualify as, you know, super bright number ones, but it's a thought. Maybe you do a bait study with discarded hatchery fish or something. If you can freeze them.
Are you referring to the hatchery fish, like roe stripping them for broodstock and then, you know, discarding them? I think at that point in the lifespan of the salmon, they've kind of degraded to the point where we'd have to recalibrate it to, you know, the semi-bright, so it'd be a whole nother study.
Yeah.
Any more questions or comments?
Steve, last year we talked a lot about sports sector reporting. Yeah, and the beef between guided and unguided charters, and we spent a lot of time on that. And I think a lot of the halibut guys, commercial guys, are a little suspect about sports sector.
Reporting. We seemed to spend a lot of time on it last year. Anything changing? Anything improving? Anybody doing anything about it?
What's the latest on that? Because that's definitely a beef we're going to hear about in January. Well, you think that—. Exactly, right?
Yeah, you think I know a lot about that because I lent— I funded a self-guided business just outside of Pelican. And, um, anyway, they didn't make it. And so now I own it. And the first thing I did was tell every employee I have, waitresses, bartenders, my guides especially, deckhands, do not tell them how to catch a halibut or where to catch a halibut. In fact, absolutely refuse to say anything.
You're self-guided. You go find your own fish. Okay. So that's what I did. And I even was asked as the owner of the Highliner Lodge, because, because the business went defunct, we didn't open it and I hadn't finished repossessing the property and the business.
So we had like 40 guests that stayed in town at our lodge, at our facilities, and yet used those boats. And, you know, they would see me and they would ask me too, and I would absolutely tell them nothing. So I don't know what, you know, the troopers or anybody that might investigate, what their stance is on this thing. But we don't tell them anything because I don't think it's fair for them to be guided and to keep to hell of a day. But I can tell you this, those 40 guests that we did have that went out absolutely unguided, and some of them had been to this other lot, to the lodge that we now own over the past year or two, they catch less than half overall of just the fish, uh, the, the filleted finished weight that we ship out.
'Cause we, we ship everything in and out ourselves too. So they catch less than half than over-guided boats, in spite of the fact that they can keep 2 halibut of any size. And we're in an area where if you want to catch bigger halibut, they're definitely— that's the part of the state to get them. So, um, I guess I meant more about the reporting of landings. I know nothing.
Absolutely nothing. Um, reporting both for, for guided and unguided in the state of Alaska is done by Alaska Department of Fish and Game. Right now, for unguided vessels, um, or just unguided anglers, your catch reporting is basically done through something— it's just like a survey that they send in the mail. Obviously, there's a lot of like non-reporting, and there's, um, concerns about that, you know. In the state.
Uh, so the state has responded and they're making— I don't know what it looks like, I'm not privy to that, but like they're, they're coming up with something that they're a lot more, um, confident in, I'm told, and it's supposed to be implemented in 2028. Um, as far as logbook reporting for, for the charter boats in the state, uh, they're all e-logbook now in 3A and 2C, which is where almost all of it is done, all the charter fishing is done in the state. So there is a lot of confidence in the e-logbook reporting for that. I think people are always going to have questions about logbooks and things. And as far as the federal side goes, right now the National Marine Fisheries Service is looking into a lot of this through something called the— it's, they're just calling it RAPID, but they're trying to modernize all of the sport fish accounting basically and catch monitoring.
No audio detected at 2:13:00
So there is ongoing development for that, especially on part of Alaska Department of Fish and Game. So it's moving forward. Are we getting that data? Is it going to IPHC? I mean, one of the governing body, if you will.
This is going to be a big deal, right? Yeah, I think that There's probably going to be updates kind of to IPHC. Ultimately, IPHC doesn't manage, you know, like domestic halibut issues, like in the United States. That's up to the Pacific Council and the North Pacific Fisheries Management Council. But all those numbers and information, I think, do go through Ian, Alan, Ray, and people.
I think, yeah, I mean, you were telling me you're our Department of Fish and Game person that does manage our catch reporting and things, they're in pretty regular communication, I think, with the staff here, with the Secretariat. Well, thank you so much. Brian, do you know, I mean, I don't even know what the definition is of self-guided officially. I don't know how they enforce that. For instance, if you get on a boat and your electronics, uh, you know, your chart plotter has a bunch of places to fish on it, I mean, that should be illegal.
Is it?
Uh, I don't honestly know. I've been told that it's illegal, but right now I think that there's a lot of gray area around it because there's no registration requirements in the state of Alaska for rental boats. There's, there's a lot of hurdles to jump through for this. So I think that there's a legal gray area around it for much of it, but hopefully that's changing soon.
Angus, I think you have a question.
Yeah, this time legitimate. I was just curious on that. Modified hook there. Uh, is there a swivel on it, or is it on the snap?
It's on a snap. Okay. And yeah, I would also be curious to see that, uh, video if we get the time at some point of the, uh, lice going after the fish. But something I've always been curious about.
It's the stuff of nightmares, but yeah, we can see about checking our website on that.
I got a question for Claude. Now that you've completed the survey or the The shuttle, what's on the horizon for whale depredation?
Great question. So we got to wrap up the analysis of the work we did in 2025, which essentially is going through the remainder of the video footage and summarizing all that. And then I think going forward, we'll be reporting on that and then trying to find support for next steps. And I kind of outlined what some of those could be at the end of that slide. So, you know, looking at hooks that leave minimal damage in the fish or a way to remove the hooks inside the shuttle that does that.
We have ideas for that, but those would require studies and funding for that. We do have two shuttles that are currently not being used that potentially could be trialed. But again, we'd have to sit down and discuss how that might work. The vessel that we did the work with last, last spring, the Oracle, they did a commercial trip with the device last fall in October. And they had a sampler board to document the results of that.
So there may be some options there for the two shuttles that are currently not being used. But outside of that, right now we don't have further work currently planned for— in the depredation space.
I think it's 4 o'clock. I suggest that we break for the day. I would encourage all of you just to think a little bit about what was presented today, what we discussed, and bring some items for discussion, new or continued, tomorrow morning. We have an hour and 15 minutes, so we're going to start at 9:00, so we have between 9:00 and 10:15 to continue our discussion. So, you know, please give that a thought, and we're going to have social, uh, starting at 4:30.
So it's same place as last year. I'll just remind you where it is. It's on, it's on 26th Avenue. It's Bizarre Brewing, starting.
No audio detected at 2:19:00