0:58
Austin Esterbrooks
27:06 - 28:05
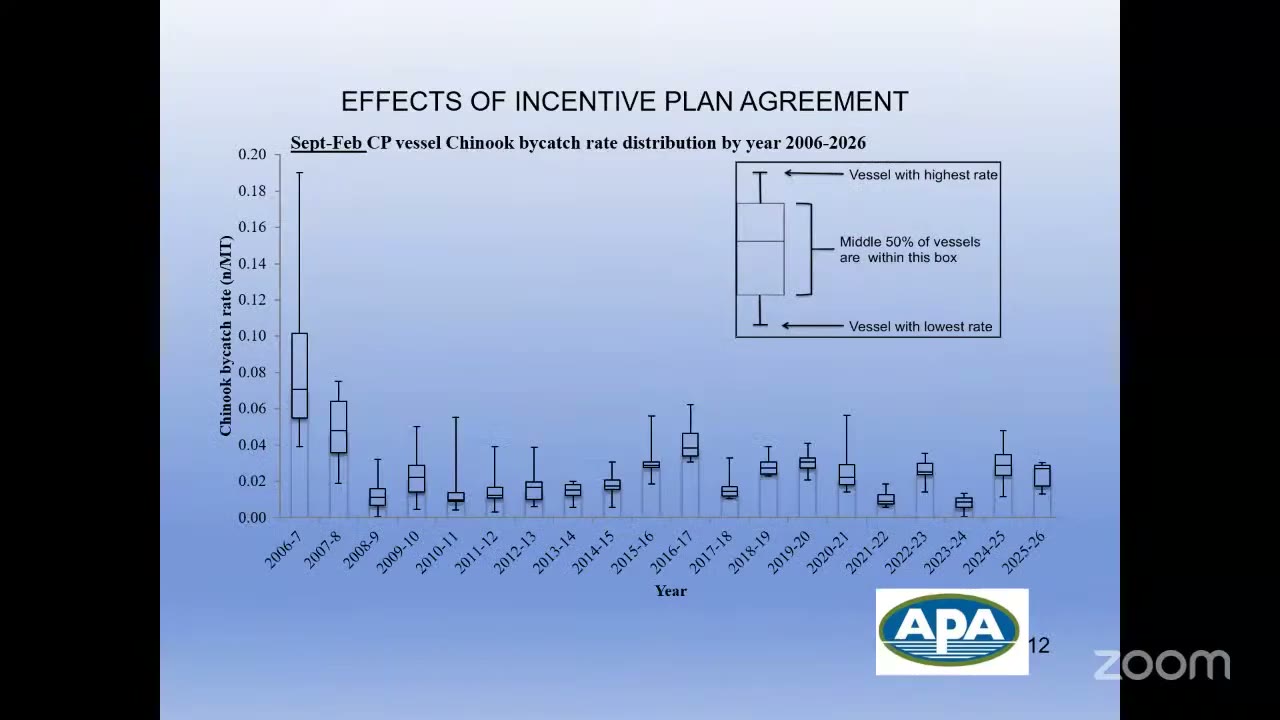
"prior to the IPA years, you can see the extremely broad distribution of individual vessel level bycatch performance on the left-hand side. And then as you move into the post-Amendment 91, 2011, and to the present, the fleet level distribution has become incredibly homogenized, and that continues to hold true in 2025 and 2026."
“prior to the IPA years, you can see the extremely broad distribution of individual vessel level bycatch performance on the left-hand side. And then as you move into the post-Amendment 91, 2011, and to the present, the fleet level distribution has become incredibly homogenized, and that continues to hold true in 2025 and 2026.”
- Speaker
- Austin Esterbrooks
- Timestamp
- 27:06 – 28:05
- Community
- Alaska News
- Captured at
- June 5, 2026
From the transcript
This is in the report. It's just a box plot figure showing the distribution of every single vessel in our fleet. And the idea is that prior to the IPA years, you can see the extremely broad distribution of individual vessel level bycatch performance on the left-hand side. And then as you move into the post-Amendment 91, 2011, and to the present, the fleet level distribution has become incredibly homogenized, and that continues to hold true in 2025 and 2026. You'll see, um, This is another statistical representation of the same sort of effect, looking at the year prior to the implementation of Amendment 91 and the most recent year.